Monitoring and Tracing for Akka Applications on Kubernetes
 Tobias Jonas
9 min read
Tobias Jonas
9 min read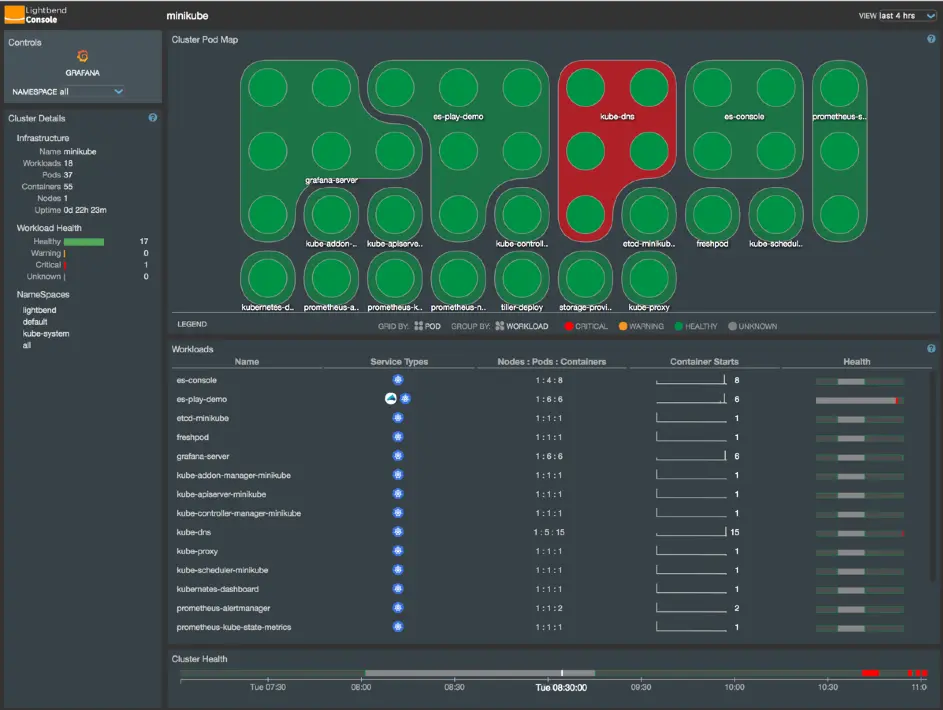
Introduction
To guarantee high availability of applications, they must be monitored using monitoring and tracing tools. For this reason, we examined various monitoring and tracing products for Akka applications. To test the products, they were integrated into our Akka demo application. The Akka demo application has also been mentioned in previous posts (https://innfactory.de/softwareentwicklung/scala-akka-play-co/akka-service-deployment-on-kubernetes/). For the subsequent concept development, one monitoring and one tracing product will be selected.
Monitoring
Introduction
There is no one-size-fits-all solution for monitoring applications, as each application is structured differently. However, there are some rules that should be followed:
Avoid Checkbox Monitoring
With this method, an attempt is made to monitor as many metrics of an application as possible. This is done out of fear that a metric might not be monitored that could be needed later. However, this usually leads to too many metrics being collected and important information being lost due to the overabundance of metrics. Therefore, it is better to start with a smaller number of metrics.
Monitoring is a Continuous Process
Another important point is that monitoring is a process that must be continuously adapted and changed. This is due to the ongoing development of the application and the acquisition of new insights when monitoring the application.
Avoid Tool Obsession
Here, an attempt is made to monitor the application comprehensively with as many different tools as possible. These attempts often fail because the large number of tools is not properly maintained and nobody can find their way around in this tool “jungle” anymore.
Proper Configuration of Thresholds
Thresholds for monitored metrics must be properly configured. An alarm that triggers too early often leads to it being ignored after a short time because it triggers too often and requires no action. Configuring thresholds is a continuous process and will take time, especially at the beginning.
Different priorities can also be set when monitoring. In this article, the focus is on monitoring application performance. Therefore, the monitoring software must provide a way to capture metrics from Akka, Scala, and the JVM (Java Virtual Machine). Various products were examined for this purpose, which are presented in the following section.
Lightbend Monitoring
Lightbend Monitoring is part of the Lightbend Enterprise Tools and consists of two products: Lightbend Monitoring and Lightbend Console. The product is developed by Lightbend Inc., which also co-develops Scala and Akka. Lightbend Monitoring was specifically developed by Lightbend Inc. for monitoring Akka, Play, and Lagom applications.
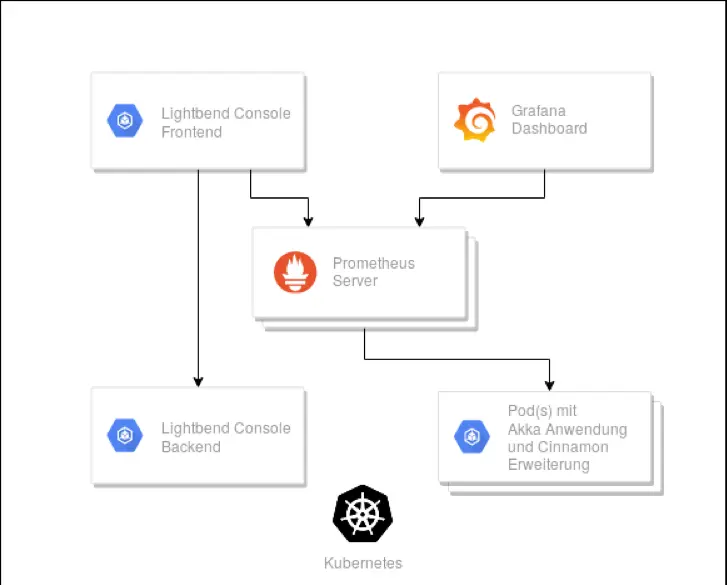
Architecture of Lightbend Monitoring.
Figure 1 provides an overview of the structure of Lightbend Monitoring when operated under Kubernetes. The individual pods of the various components of Lightbend Monitoring are shown. To obtain telemetry data from the Akka application, the Cinnamon extension is integrated into the Akka application. The Cinnamon plugin consists of a Java agent that collects telemetry data about Akka and the JVM and opens a web server through which the telemetry data can be accessed. Prometheus collects this provided data and stores it. Grafana and Lightbend Console are used to visualize the collected telemetry data.
Figure 2 shows the Lightbend Console. The upper section shows the various deployments; each point represents a pod. The different colors indicate whether the deployment or pod is running properly. The lower section shows additional information about the deployments, such as the number of nodes, pods, and containers, as well as the health status of the deployments over a longer period.
Kamon
Another product on the market is Kamon. Kamon is software licensed under Apache 2. At first glance, Kamon appears to be a more cost-effective version of Lightbend Monitoring.
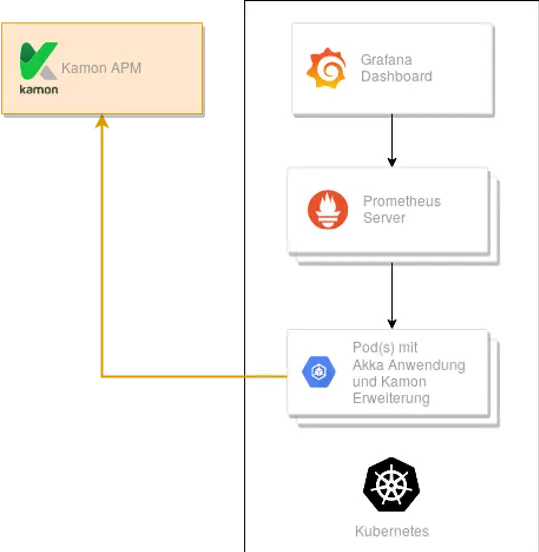
Architecture of Kamon Monitoring.
Figure 3 provides an overview of the structure of Kamon. It is similar to the structure of Lightbend Monitoring. The Akka application contains the Kanela extension, which includes a Java agent. By integrating the Kamon Prometheus extension, the collected telemetry data can be accessed by a Prometheus server. The collected data is visualized in various Grafana dashboards. In addition to Akka, Kamon is also compatible with the Play Framework.
In Figure 3, Kamon APM (Application Performance Management) is shown in orange. Kamon APM is a paid solution. With this solution, the collected metrics are sent to Kamon, which handles storage and visualization through pre-built dashboards. To use Kamon APM, the Kamon APM Reporter extension must be integrated.
Istio
Since the Istio website also advertises for the monitoring area, it was also considered. Istio is a free service mesh licensed under Apache License 2. Collecting metrics for Akka, Scala, and JVM is not supported. Therefore, it was discarded for the monitoring area.
Tracing
Introduction
Tracing is a useful tool for troubleshooting and optimizing applications. With the introduction of distributed systems, tracing has become increasingly complex.
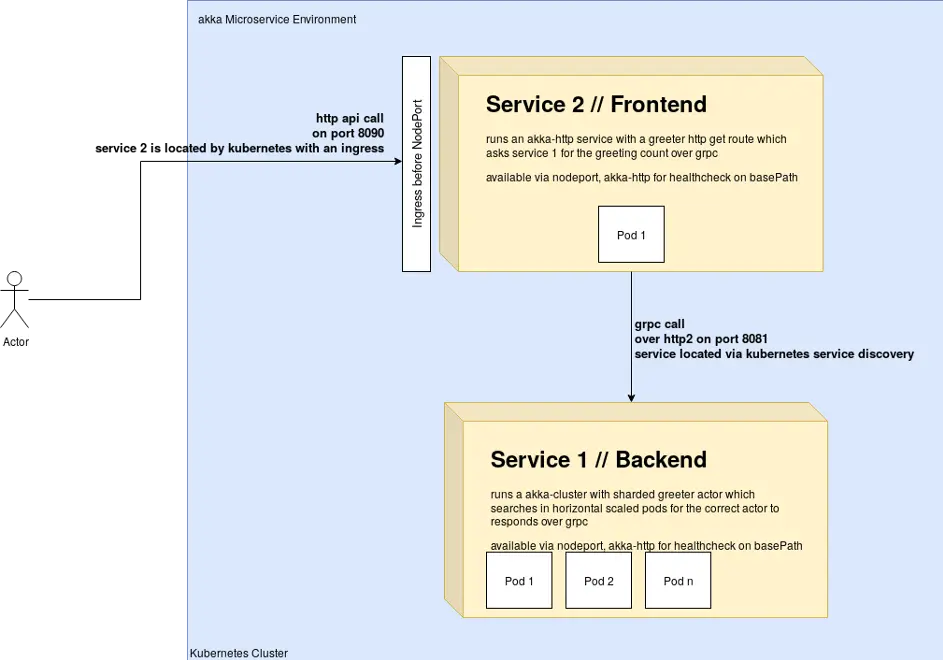
innFactory Akka Cluster Kubernetes Application
Figure 4 shows the demo application. The goal of tracing is to record the request from the moment it arrives at service two and track it through the entire system. The smallest unit created when recording a request to the application is a span. Figure 5 shows a trace of the demo application. On the left side, you can see the various spans that make up a trace. The topmost and thus initial span has been expanded to show the details. This is the point where the client’s request hits the web service. The spans visible here all originated in service two of the demo application. A trace can therefore contain spans from one or more microservices.
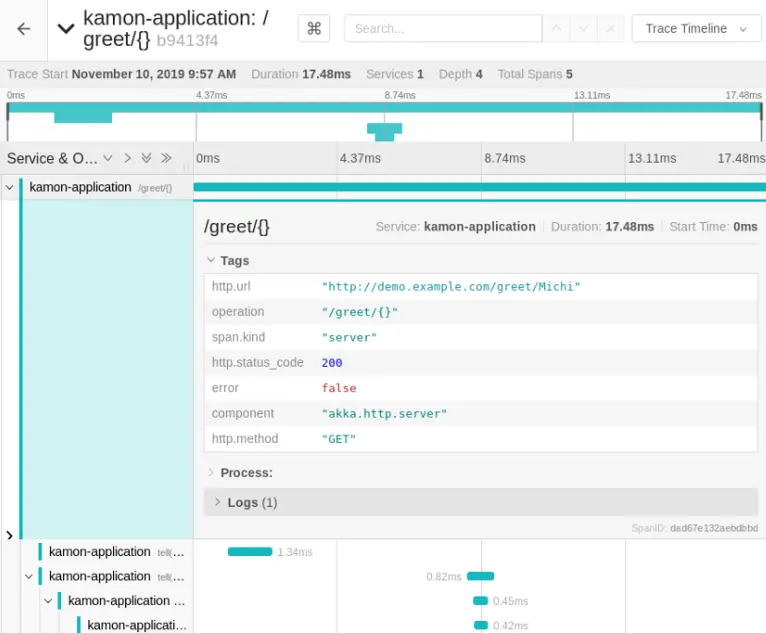
Trace of the demo application displayed in Jaeger Tracing.
For tracing, the products Zipkin and Jaeger were examined.
Jaeger
Jaeger is used for tracing distributed systems and is licensed under Apache 2. It was originally developed by Uber Technologies. It is now a project of the Cloud Native Computing Foundation.
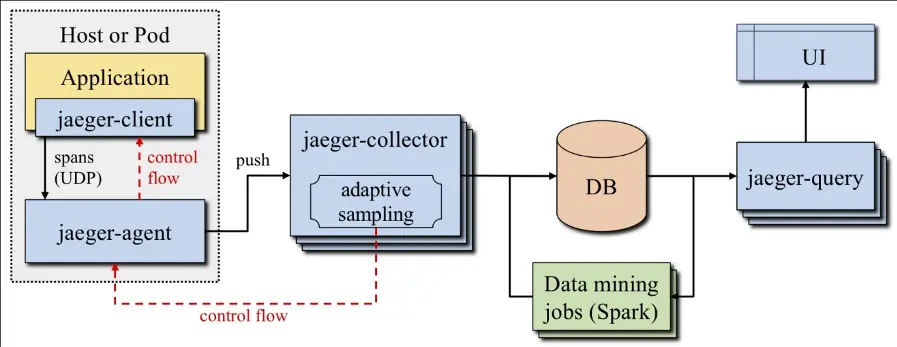
Jaeger Architecture. (Source: Mastering Distributed Tracing, ISBN: 978-1-78862-846-4)
Figure 6 shows the architecture of Jaeger. The Jaeger Client consists of the tracing library running in the application to be monitored. This library collects spans and sends them to the Jaeger Agent. Data transmission to the Jaeger Agent takes place via User Datagram Protocol (UDP). The Jaeger Client also has the option to bypass the Jaeger Agent and send the data directly to the Jaeger Collector. Depending on the complexity and size of the application to be monitored, sending directly to the Jaeger Collector or going through the Jaeger Agent may be advantageous. Through the control flow in the graphic, it is possible to communicate configuration changes to the Jaeger Client and Agent.
The Jaeger Agent runs as a sidecar in the pods of the application to be monitored and forwards the data to the Jaeger Collector. The Jaeger Collector receives the spans from the Jaeger Agents in Zipkin or Jaeger format via HTTP, GRPC, or TChannel protocols. The received data can be encoded in JavaScript Object Notation (JSON), Thrift, or Protocol Buffers (Protobuf). After receiving the data, it is converted to an internal data model and stored in the database. Kafka, Cassandra, or Elasticsearch can be used as the database. If Jaeger is only installed for testing, there is also the option to use the local disk storage of the Jaeger instance to store the data. The Jaeger Query component is used by the user interface to query the stored data.
The data mining jobs are optional and can be used to further analyze the collected tracing data. For example, they can be used to build graphs showing the dependencies of one service on other services.
Zipkin
Like Jaeger, Zipkin is also suitable for tracing distributed systems and is also licensed under Apache 2. Zipkin was originally developed by Twitter and has been around longer than Jaeger.
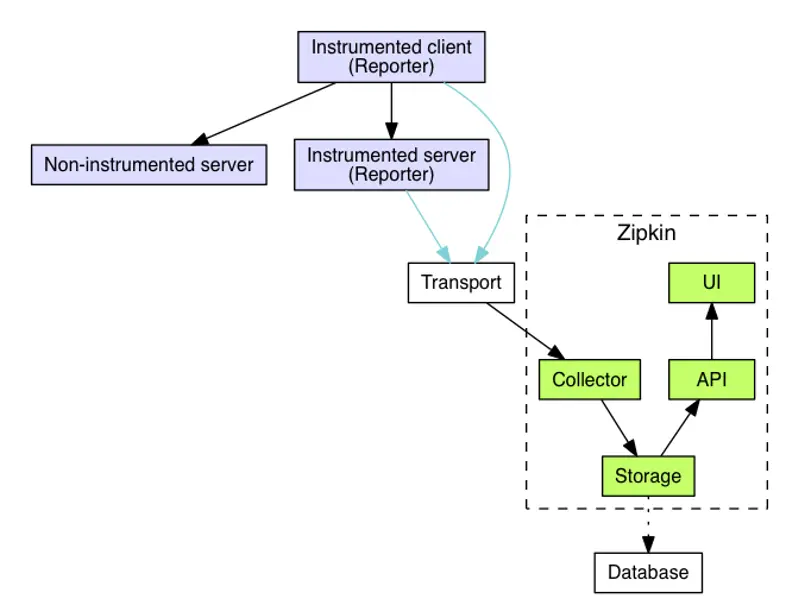
Zipkin Architecture. (Source: https://zipkin.io/pages/architect)
As shown in Figure 7, the structure of the Zipkin architecture is similar to the Jaeger architecture. Here, a so-called reporter must run in the application to collect the data for tracing and send it to the collector. HTTP, GRPC, or Advanced Message Queuing Protocol (AMQP) can be used as the data transmission protocol. The collector validates and indexes the data and sends it for permanent storage. Cassandra, ElasticSearch, or MySQL can be used to store the tracing data. Additional systems can be connected via third-party extensions. To make the data easily accessible, Zipkin provides an HTTP interface through which the data is made available in JSON format. Zipkin provides its own web interface for displaying the data.
Concept for Monitoring and Tracing
For the concept development, Kamon was selected for monitoring. This is because the license costs for Lightbend Monitoring are very high. Also, the functionality of Kamon is almost identical to that of Lightbend Monitoring. Istio is not considered further as it does not meet the required functionality.
In the area of tracing, Jaeger was selected. Zipkin and Jaeger are almost identical in terms of functionality. However, Jaeger offers better Akka support and supports the Opentracing standard. Opentracing is a vendor-independent and standardized framework for tracing.
Figure 8 shows a concept that was created for Laura AI.
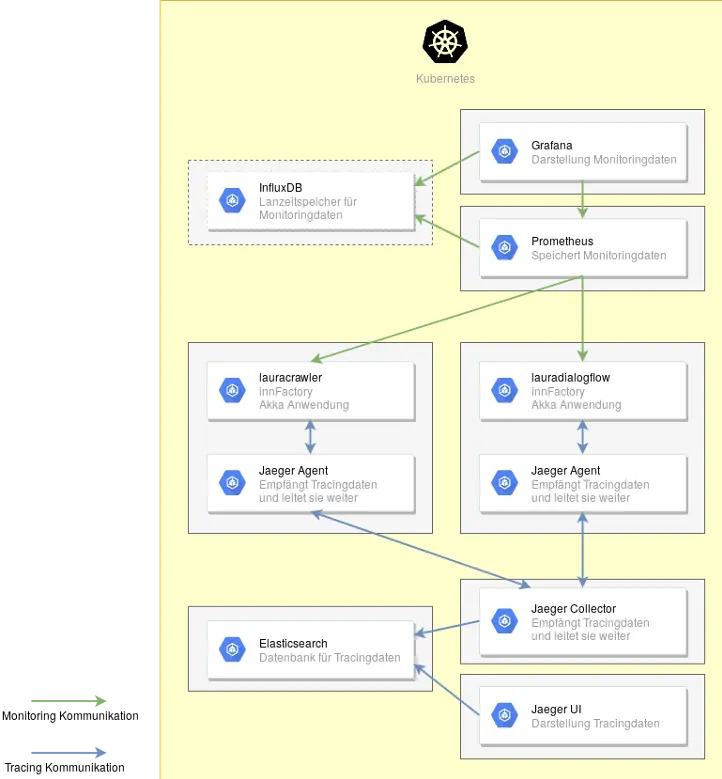
Laura AI with Kamon and Jaeger Implementation.
Monitoring
In the upper right of Figure 8, you can find the two pods Prometheus and Grafana, which contain the monitoring. Dashboards can be created in Grafana to visualize the data. For this, Grafana retrieves data from Prometheus and InfluxDB. Grafana also handles alerting through various channels. Prometheus handles collecting and storing the data. Lauracrawler and lauradialogflow contain the Kamon Prometheus extension so that Prometheus has an interface available for collecting data. The pod in the upper left with InfluxDB is optional, as indicated by the dashed line. If present, Prometheus additionally writes the collected metrics to InfluxDB. This is only needed if the monitoring data needs to be retained for a longer period and the disk space under Prometheus is not sufficient.
Tracing
In Figure 8, the two lower pods are responsible for tracing. The Kamon Reporter for Jaeger is integrated in lauracrawler and lauradialogflow. It is configured to forward the data to the Jaeger Agent. The Jaeger Agent then passes this data to the Jaeger Collector. There is also the option to bypass the Jaeger Agent and send the data directly to the Jaeger Collector. Whether this can be bypassed depends on the amount of data being transmitted. For better scalability, the use of the Jaeger Agent is recommended. The Jaeger Collector sends the data to Elasticsearch for storage. Elasticsearch is recommended here as it can be extended to a complete Elasticsearch, Logstash, Kibana (ELK) stack if needed at a later time. If the environment is very large, multiple Jaeger Collectors can also be used. Jaeger UI only serves to visualize the data. The arrows between Jaeger Collector, Jaeger Agent, and lauracrawler/lauradialogflow go in both directions because the tracing data is sent from the Akka application to the Jaeger Collector and configuration data is sent from the Jaeger Collector to the Akka application.
Practical Test
Various branches in the GitHub repository of the demo application are available for testing the different software solutions with minimal effort:
- Kamon and Jaeger: https://github.com/innFactory/akka-microservice-example/tree/kamon_jaeger
- Lightbend Monitoring: https://github.com/innFactory/akka-microservice-example/tree/lightbend_monitoring
- Istio: https://github.com/innFactory/akka-microservice-example/tree/istio
The kamon_jaeger branch tests the concept described in Figure 8. In the respective branches, a markdown file describing the setup is included in the directories monitoring-and-tracing, lightbend_monitoring, or istio.